Model File (NC/I7) Processing
The FEMAG models and many simulation results are saved into files with extension nc which is based on the open standard format NetCDF For FEMAG releases earlier than 9.0 the extension is I7/A7 (windows) or ISA7/AUX7 (unix) which is a proprietary format.
For both file formats corresponding modules nc and isa7 exist (filename extension is optional):
isa = femagtools.isa7.read('foo')
nc = femagtools.nc.read('foo')
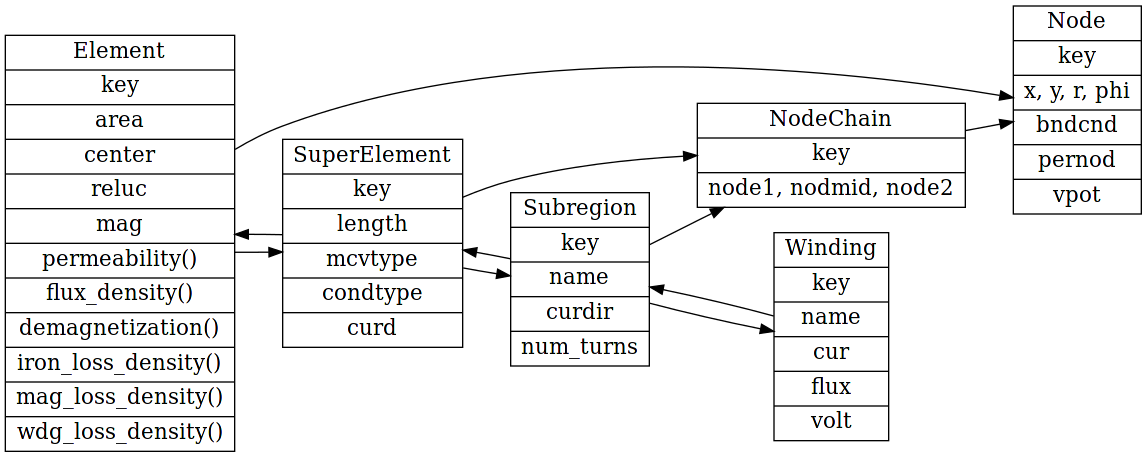
The file is structured as follows:

in addition following general data is provided:
Parameter |
Description |
Unit |
|---|---|---|
FC_RADIUS |
radius to center of airgap |
m |
arm_length |
Effective lenght of iron |
m |
num_poles |
Number of poles |
|
pole_pairs |
Number of pole pairs |
|
poles_sim |
Number of poles in model |
|
num_slots |
Number of slots |
|
delta_node_angle |
Angle between 2 nodes in airgap |
rad |
pos_el_fe_induction |
rotation positions (mpos) |
rad |
el_fe_induction_1 |
flux density comp 1 (radial) (nel, mpos, icur, ibeta) |
T |
el_fe_induction_2 |
flux density comp 2 (tangential) (nel, mpos, icur, ibeta) |
T |
eddy_cu_vpot |
eddy current vector potential (nel, mpos, icur, ibeta) |
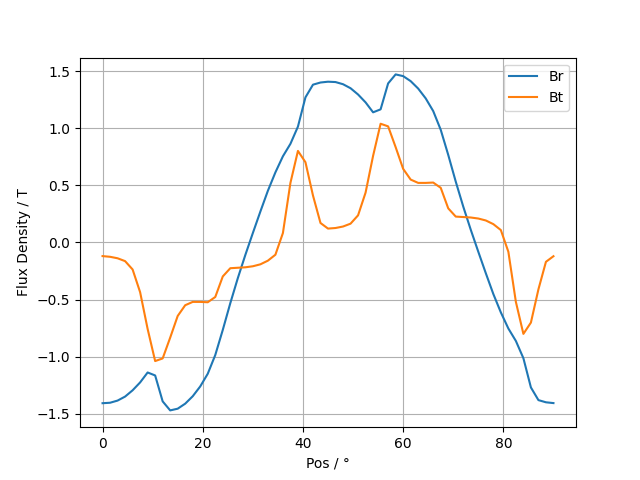
Example:
plt.plot(nc.pos_el_fe_induction*180/np.pi,
         nc.el_fe_induction_1[0, :, 0, 1], label='Br')
plt.plot(nc.pos_el_fe_induction*180/np.pi,
         nc.el_fe_induction_2[0, :, 0, 1], label='Bt')
plt.xlabel('Pos / °')
plt.ylabel('Flux Density / T')
plt.grid()
plt.legend()

General Functions
Function |
Description |
|---|---|
get_areas |
return areas of (in m²) of inner and outer regions slots, iron, magnets |
get_mass |
|
calc_iron_loss(icur, ibeta, |
calculate iron (core) loss |
pfefun, bmin=0.1) |
|
demag_situation(icur, ibeta, hlim) |
demagnetization of each magnet |
rotate(angle) |
rotate inner part by angle (rad) |
scale_factor |
scale factor of model |
Plotting
The plot module provides functions for creating contour plotts nc and isa model files.
Function |
Description |
|---|---|
spel(nc, subregions=[], |
|
with_axis=False, ax=0) |
super elements (of subregions) |
mesh(nc, with_axis=False, ax=0) |
mesh |
demag(nc, cmap=DEFAULT_CMAP, ax=0) |
Demagnetization of last simulation |
demag_pos(nc, pos=-1, icur=-1, |
|
ibeta=-1, cmap=DEFAULT_CMAP, ax=0) |
Demagnetization of pos, cur, beta |
flux_density(nc, subreg=[], |
|
cmap=DEFAULT_CMAP, ax=0) |
Flux density of last simulation |
flux_density_pos(nc, ipos, subreg=[], |
|
icur=-1, ibeta=-1, |
|
cmap=DEFAULT_CMAP, ax=0) |
Flux density at pos with cur, beta |
loss_density(isa, subreg=[], |
|
cmap=DEFAULT_CMAP, ax=0) |
Loss density of last simulation |
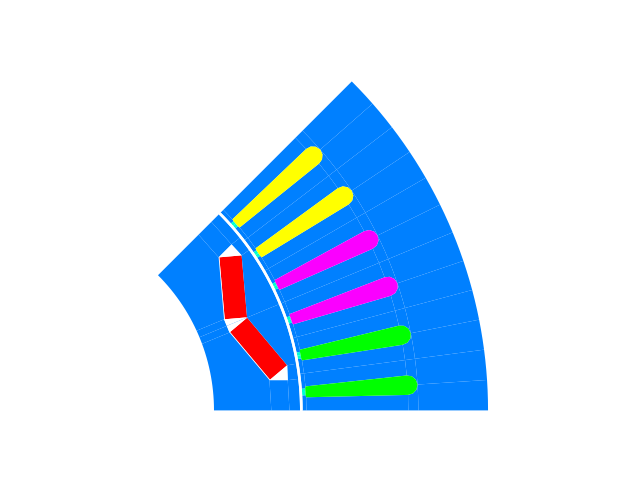
Examples:
femagtools.plot.mesh(nc)
femagtools.plot.spel(nc)


